Monday, the Environmental Protection Agency rolled out the centerpiece of President Obama’s climate strategy — a plan to limit carbon dioxide emissions from the nation’s power plants. The main takeaway was that by 2030 the regulations will cut these emissions, the biggest single driver of global warming, by 30 percent compared to 2005 levels. But under the hood, things get a little more complex.
Rather than a consistent national standard, the proposed rule sets a different standard for every state, based on the EPA’s assessment of what each state can realistically achieve using existing technology at a reasonable cost. The goal applies to a state’s carbon intensity, the measure of how much carbon pollution comes from each unit of electricity produced in that state, rather than total carbon emissions. States like Kentucky and West Virginia, for example, rely heavily on coal power and have a higher carbon intensity than states like California that are more energy-efficient and have more renewable energy. By 2030, each state will be required to meet a carbon intensity target lower than where it is today; how much lower, exactly, depends on what the EPA thinks the state can pull off.
States will have broad leeway to devise individual plans to meet their targets, which could include installing air-scrubbing technology on plants themselves, adopting more robust energy efficiency standards, or switching from coal to cleaner sources like natural gas or renewables.
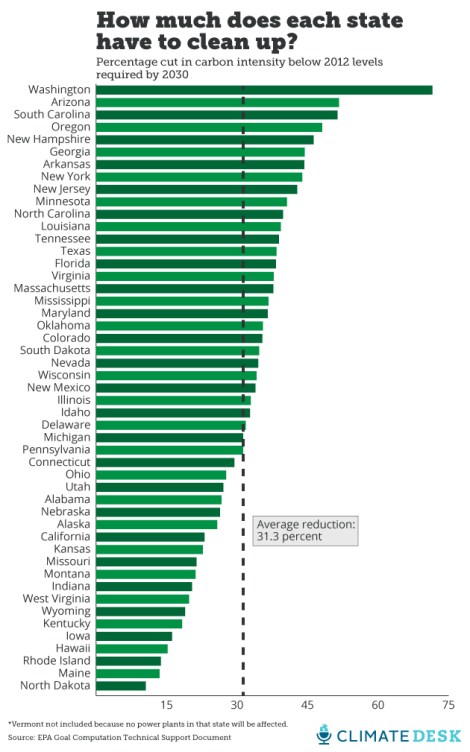
Here’s a ranking of which states will have to shrink their carbon footprint the most:
States at the top of that ranking have the biggest improvements in store, but that doesn’t necessarily mean they have the most difficult tasks: An aggressive goal is a sign that the EPA sees a lot of clean-up potential within reach. (Washington, for example, is already leading on zero-emission hydropower, and Arizona is doubling down on solar.) Policy factors, like energy efficiency requirements, are also significant. By contrast, states at the bottom of the ranking tend to be those for whom change is more difficult because of an entrenched dirty power system (like Kentucky), or who are already quite clean to begin with (like Maine).
In practice, the target calculation isn’t quite that simple; in fact, the EPA’s custom-built algorithm includes a plethora of variables that are interesting and decipherable only to the geekiest energy wonks, which gives you some idea of how difficult setting climate policy can really be when the rubber hits the road. As an example, here’s the equation for deducing what the final goal for the state of Ohio should be:
![]()
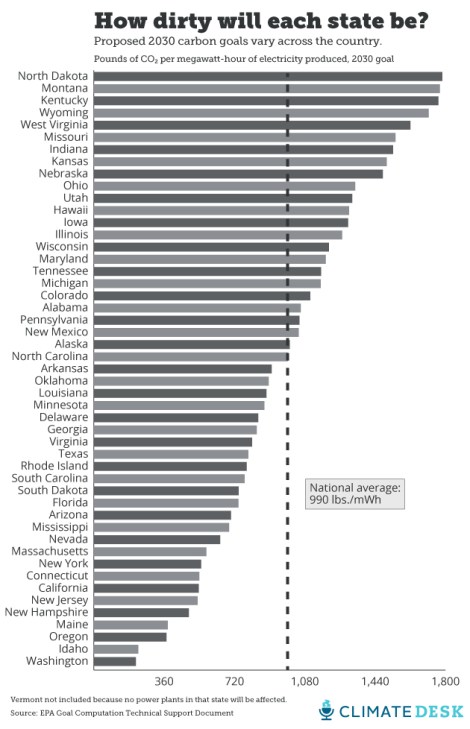
Clear as crystal, right? This complicated step in the process — how the EPA decides what’s reasonable for a state — is a likely Achilles’ heel for the inevitable legal attacks on this rule from industry groups. A few lucky energy lawyers are going to get to pick this apart, and judges will decide if it really makes sense. (The EPA’s legal track record here is actually quite good, as the Supreme Court has a tendency to defer to the agency as experts who presumably know what they’re doing.) Fortunately for us mortals, it all boils down the one number in bold: the state’s specific target. Here’s a different ranking of states, based only on what their final carbon intensity will be in 2030. As you might expect, states that are dirty now and still going to be relatively dirty in the future — but a little less so.
 This story was produced as part of the Climate Desk collaboration.


