I don’t mean to harp on the Arctic ice melt. I don’t. But literally every day it gets worse. At some point soon it’s supposed to start re-freezing, but that hasn’t happened yet.
The ice loss is a fascinating, terrifying marker of how global warming is advancing — and the ice loss can itself make warming worse. There are a ton of great resources to track what’s happening with Arctic ice levels. Call it iceporn, if you will. And consider this post your Penthouse.
The National Oceanic and Atmospheric Administration has a number of cameras near the North Pole. This is a timelapse from one, beginning on June 30 and running until August 12. Keep an eye on the black-and-white poles that you’ll see; they measure the depth of the ice cover.
Go full-screen if you can.
Jim Pettit has compiled a series of awesome, scary graphs.
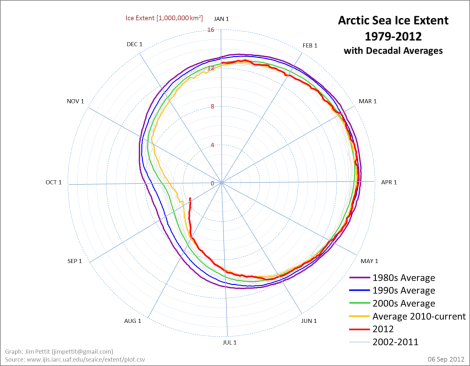
Here’s what he calls the “Ice Volume Death Spiral.”
It’s a little tricky to read. The red line indicates ice volume in 2012. The vertical line from the center point marks January 1; the line then winds around the center as the year progresses. It’s about three-quarters of the way around because we’re nearly three-quarters of the way through the year. Once that line hits the center point, the ice volume in the Arctic has hit zero. No ice. It won’t happen this year.
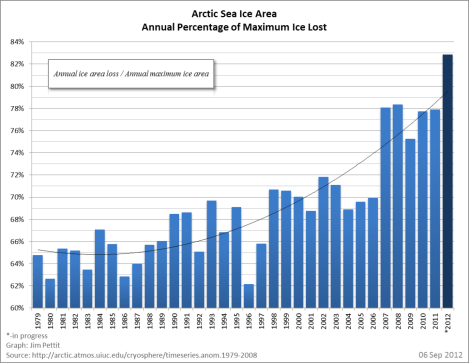
Here’s another graph, depicting the percent of ice loss. Notice that the left axis only goes to 84 percent.
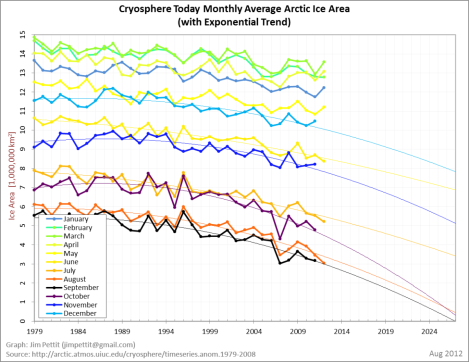
And this is the scariest of all: Pettit’s projection for when the Arctic will be ice-free, by month:
The first ice-free month will be August or September of some year before 2030. Unless, of course, we have a year with unusual ice loss. Like, say, 2012.
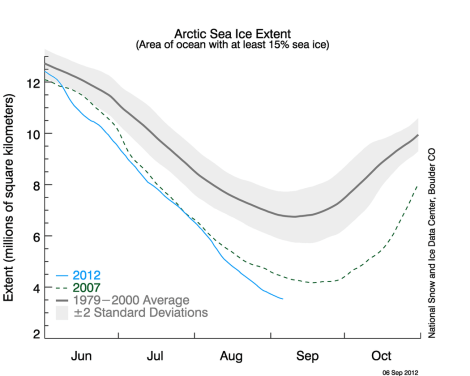
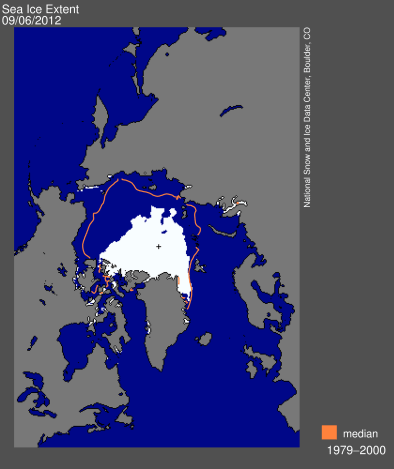
Then there are the by-now-standard charts from the National Snow and Ice Data Center, which estimates that we still have a week left in the melt season. Here’s the ice extent (surface coverage) as of yesterday, far below the previous all-time lowest level.
And, finally, the view from the top: ice extent as viewed from space.
Smaller and smaller and smaller and then — not this year, but some day — blink!
Gone.

