For a long time, the holy grail of solar photovoltaics (PV) has been “grid parity,” the point at which it would be as cheap to generate one’s own solar electricity as it is to buy electricity from the grid. And that is indeed an important market milestone, being achieved now in many places around the world. But recently it has become clear that PV is set to go beyond grid parity and become the cheapest way to generate electricity.
Whenever I say this I encounter incredulity, even vehement opposition, from friends and foes of renewable energy alike. Apparently, knowledge of the rapid developments of the last few years has not been widely disseminated. But it’s happening, right under our noses! It is essential to understand this so that we can leverage it to rapidly switch to a global energy system fully based on renewable energy.
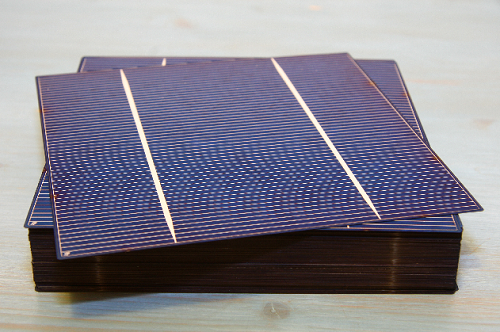
 A hundred solar cells, good for 380 watts of solar PV power.Photo: Ariane van DijkWorking on solar PV energy at Ecofys since 1986, I have seen steady progression: efficiency goes up, cost goes down. But it was only on a 2004 visit to Q-Cells‘ solar cell factory in Thalheim, Germany, that it dawned on me that PV could become very cheap indeed. They gave me a stack of 100 silicon solar cells, each capable of producing 3.8 watts of power in full sunshine. I still have it in the office; it’s only an inch high!
That’s when I realized how little silicon was needed to supply the annual electricity consumption of an average European family (4,000 kWh). Under European solar radiation, it would take 1,400 cells, totaling less than 30 pounds of silicon.
Of course, you need to cover the cells with some glass and add a frame, a support structure, some cables, and an inverter. But the fact that 30 pounds of silicon, an amount that costs $700 to produce, is enough to generate a lifetime of household electricity baffled me. Over 25 years, the family would pay at least $25,000 for the same 100,000 kilowatt-hours (kWh) of electricity from fossil fuels — and its generation cost alone would total over $6,000!
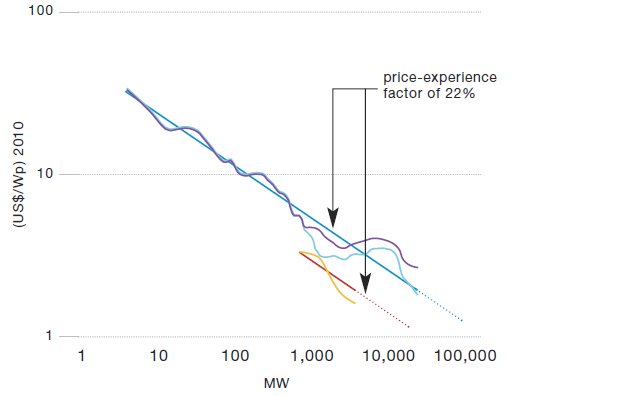
At a very large scale, the cost of manufacturing anything drops to just above the cost of its base materials. As scale goes up, per-unit costs come down. This is known as a “learning curve” — the price per unit of capacity comes down by x percent for every doubling of cumulatively installed capacity. For solar PV modules, the learning rate has been exceptionally high, averaging 22 percent for the past two decades. The cost of the “balance of system,” i.e., all other components needed, follows this trend line closely. So this is what we see happening now in PV:
 Learning curve for silicon-based solar PV modules. Note the logarithmic scales. Colored lines represent various technologies.Image: Wim Sinke, ECN. Sources: Navigant Consulting, EPIA
To unleash the power of a steep learning curve, you need a market driver when costs are still high; we should all be grateful to Germany for playing that role since the introduction of a feed-in tariff there in the year 2000.
Under the German renewable energy scheme, a family or company investing in a solar PV system receives a fixed amount per kWh of solar electricity supplied to the grid. The additional costs are distributed over all users of the grid, nationwide. Successive governments, in varying coalitions, have kept the principle alive, continuously lowering the tariffs as scale went up and cost came down. Contrary to what some believe, competition on the German PV market has always been fierce, which of course is a driving factor behind the ensuing cost (and price) reductions.
In 2004, the feed-in tariff was $0.77 per kWh. For 2012, the tariff for large, ground-based systems is already down to $0.23 per kWh, in spite of eight years of inflation. Expectations are that, even at this low tariff, between 3,500 and 5,000 megawatts of new PV capacity will be installed in Germany next year. This means that the PV supply chain and investors can earn a living at $0.23 per kWh, including operation and maintenance cost, margins, and return on capital.
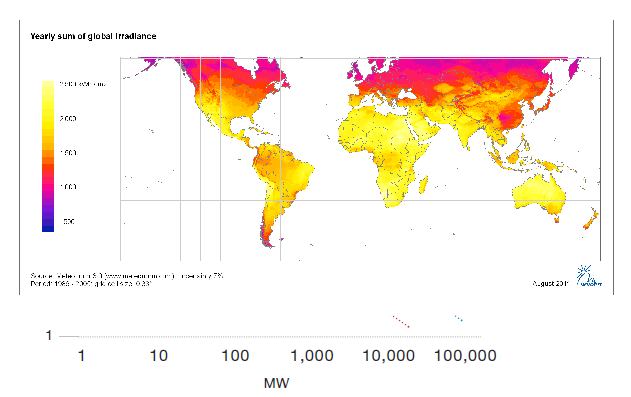
But that’s in Germany. The funny thing is: Germany is not very sunny! Average annual solar radiation in the sunniest parts of the country, where most PV systems are installed, is 1,000 to 1,100 kWh per 10.8 square feet, measured on a horizontal plane. The world map below shows that this is substantially less than in most of the world. In a sunnier region, like the southwestern U.S., solar radiation is double Germany’s, so the same installed capacity (in watts) will produce twice as much solar electricity (in kWh). As a consequence, the cost of a solar PV kWh in Arizona is only half of the cost in Germany, i.e., already below $0.12. That’s right now, without any subsidies or tax breaks.
 Solar radiation map of the world.Image: Meteotest
But what of the competition? Aside from PV, the bulk of new power plants these days are either natural gas-fired, coal-fired, or wind energy. Nuclear is a would-be competitor, but so little of it has been built in recent decades that real cost data are scarce; the trend seems to be sharply up, however, and little is known about the cost of additional post-Fukushima safety measures.
Costs vary per country, and fossil fuels mostly don’t get the right costs allocated for their CO2 emissions, but let’s take two recent studies for the U.S. here. The Brattle Group published the Connecticut Integrated Resource Plan [PDF] in 2008. They found levelized cost per kWh for natural gas-fired power plants to be $0.076 to $0.092, and for coal, $0.086, both without carbon capture and storage. And in 2009, MIT issued its Update on the Cost of Nuclear Power [PDF], in which they found levelized cost per kWh for nuclear’s competitors of $0.062 (coal) and $0.065 (natural gas), without any charge for CO2 emissions.
The cost of wind energy is already close to competitive with gas and coal. The recent Global Status Report [PDF] by REN21 states its kWh-cost for suitable locations as $0.05 to $0.09, for an average of $0.07. Wind power cost is still decreasing, due to learning effects, but at a much lower rate than the cost of PV.
It is highly unlikely that fossil fuels will get away without any charge for CO2 emissions in the long run. In a growing number of countries, such as the 27 countries of the European Union and Australia, this market distortion has already (mostly) come to an end. But let’s assume that the cost of solar PV electricity needs to drop to below $0.06 per kWh to live up to the claim that it’s the cheapest source of electricity. In sunny regions, we will need to halve the cost of PV power again to make that happen. Three doublings of cumulative capacity will do, since, according to PV’s rapid learning curve, every doubling of capacity leads to a cost reduction of 22 percent. After three doublings the cost will be multiplied by 0.78 * 0.78 * 0.78 = 0.47.
Cumulative installed PV capacity globally was 40 gigawatts (GW) at the end of last year. Three doublings mean this has to grow
by a factor of eight, to 320 GW, to achieve the necessary halving of cost. From 2005 to 2010, PV capacity installed annually grew by an average of 49 percent per year. Even if this slows down to 25 percent per year in the near future, we will reach 320 GW in 2018 — that’s only seven years from now!
To be sure, that was starting from a present PV kWh cost of $0.12, valid for sunny regions like the Southwest U.S. As can be seen from the solar map above, the regions with at least comparable solar radiation include most of Latin America, Africa, the Middle East, Australia, and large swaths of Asia, including all of India. For all those regions, PV will be the cheapest option by 2018. After that, further increases in cumulatively installed capacity will drive PV cost further down, making it grow swiftly in the regions in which it is the cheapest option to generate electricity.
This development does not, in itself, make life easy. Developing a world energy system that runs on 100 percent renewable energy by 2050 is a major and complex global effort, involving large investments in energy efficiency, renewable energy, and infrastructure, as we have shown in “The Energy Report” [PDF]. But it sure helps a lot!


